General information only. This page describes common causes of operating problems to help you frame a diagnosis. It is not an instruction or authorisation to modify, bypass or operate equipment. Desalters, dehydrators and hydrogen units involve high voltage, pressure, flammable fluids and hydrogen. Follow your site procedures, permit-to-work system and management of change process.
Symptom index: desalters, dehydrators and electrostatic coalescers
These symptoms apply equally to electrostatic coalescers in dehydrator duty and in desalter duty, because the equipment is the same. Each entry can be linked to directly.
High BS&W at desalter outlet
High basic sediment and water (BS&W) at the desalter or dehydrator outlet means that water droplets are leaving with the crude instead of settling. Either the droplets are not coalescing, or they do not have the time or the viscosity conditions to settle. The most common reason is a change upstream: crude blend, water cut, temperature or chemical dose.
Probable causes and the data we would request: High BS&W at desalter outlet
Probable causes
- Treating temperature below design, so viscosity at the grids is higher than the vessel was sized for.
- A change of crude or blend: heavier, more viscous, or carrying more asphaltenes, solids or production chemicals that stabilise the emulsion.
- Demulsifier under-dosed, overdosed, changed, or injected too close to the vessel to act.
- Mixing valve pressure drop set too high, creating droplets too fine to coalesce (desalter duty).
- Throughput above the design grid loading, or wash water rate above the vessel’s water handling capacity.
- Low or unstable grid voltage, from a high interface, a wet feed or a failing bushing or insulator.
- A thick emulsion band at the interface shortening the settling zone.
- Inlet distributor or outlet collector fouled or damaged, giving uneven flow through the grids.
- Slugs of water, slop or tank bottoms arriving faster than interface control can follow.
Data we would request
- Outlet and inlet BS&W by the same laboratory method, with sample times, for 2 to 4 weeks spanning the change.
- Crude temperature at the vessel inlet, crude rate and wash water rate trends.
- Mixing valve pressure drop trend (desalter duty).
- Grid voltage and current for each transformer.
- Interface level trend and any try-cock or sample-line observations of the emulsion band.
- Crude density and viscosity at two temperatures; blend records; tank and slop movements.
- Demulsifier type, dose and injection point, and any recent change.
High salt at desalter outlet with normal BS&W
High salt at the desalter outlet while BS&W stays normal means the vessel is still removing water but the water left behind is too salty. The wash water is not reaching and diluting the brine droplets, or the wash water itself is carrying salt.
Probable causes and the data we would request: High salt at desalter outlet with normal BS&W
Probable causes
- Mixing valve pressure drop too low, so wash water and brine droplets do not make contact.
- Wash water rate too low for the inlet salt.
- Wash water salinity or hardness higher than design, for example after a change of water source or a rise in recycle salinity.
- Inlet salt higher than the design basis: a new crude, poor upstream dehydration, or salt crystals in very dry crude that water cannot reach.
- Wash water injected at a single point too close to the mixing valve, where part-injection upstream of the preheat exchangers would give more contact time.
- In two-stage units, recycle from the second stage reduced or lost.
Data we would request
- Inlet and outlet salt in PTB by a stated method, with BS&W for the same samples.
- Wash water rate, source and analysis: chlorides, hardness, pH.
- Mixing valve pressure drop trend, and results of any step tests.
- Crude slate and the salt content of each crude.
- For two-stage units, interstage salt and recycle rate.
Coalescer power unit tripping
A coalescer power unit that trips, or runs at low voltage and high current, is seeing a conductive path between the energised electrode grids and earth. The power unit is usually reporting a process problem inside the vessel. Less often it is reporting its own failure or that of a bushing or insulator.
Probable causes and the data we would request: Coalescer power unit tripping
Probable causes
- Oil-water interface too high, bringing conductive water close to the lower grid. A faulty or fouled interface instrument is a common reason.
- Emulsion band grown upwards into the grid zone.
- Feed water cut above the limit the grids tolerate, continuously or in slugs.
- High-conductivity crude or contaminants such as slop, caustic or conductive solids.
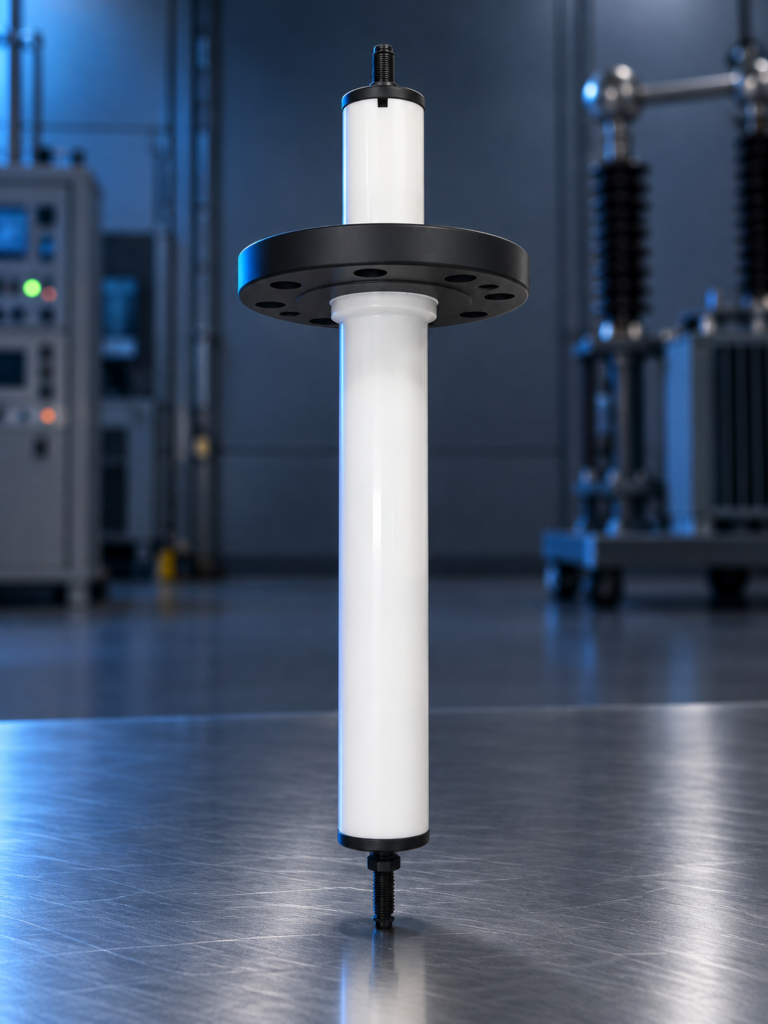
- Entrance bushing failed or tracking, often after water or deposits reach its surface.
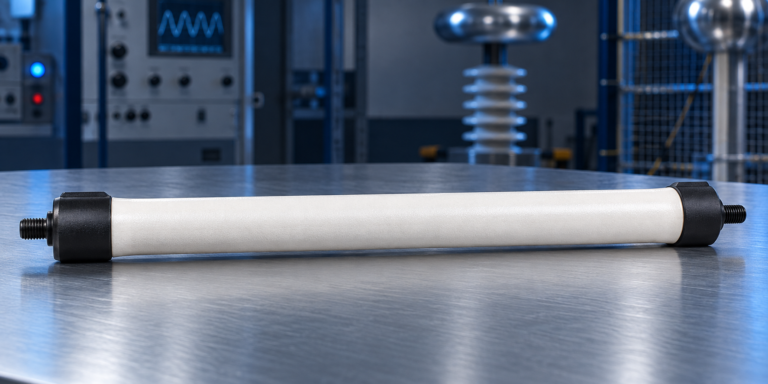
- Electrode insulator or hanger cracked, fouled or carbon-tracked.
- Grid mechanically displaced or damaged, reducing clearance to earth.
- Transformer, reactor or protection relay fault, or low oil level in the transformer or bushing housing.
Data we would request
- Voltage and current trends for each power unit, with the time of each trip.
- Interface level trend, and a cross-check by try-cocks or sample lines if fitted.
- Feed water cut and rate trends around each trip.
- Transformer nameplate photo, single-line diagram and protection settings.
- Insulation resistance and any electrical test results, taken under your site’s electrical safety rules.
- Date and findings of the last internal inspection; age of bushings and insulators.
Emulsion band growth
Emulsion band growth is the thickening of the rag layer, the zone of unresolved emulsion, solids and wax at the oil-water interface. Every coalescer has one. It becomes a problem when it grows upward towards the grids, where it drags voltage down, or downward, where it sends oil out with the effluent water.
Probable causes and the data we would request: Emulsion band growth
Probable causes
- Fine solids, such as iron sulphide, clays, scale and corrosion products, stabilising the interface.
- Asphaltene precipitation from incompatible crude blends.
- Slop, tank bottoms or recovered oil being processed.
- Demulsifier unsuited to the current crude, or overdosed.
- High wash water pH forming soaps with naphthenic acids.
- Mixing valve pressure drop too high.
- Treating temperature too low, or near the wax appearance temperature.
- No mud wash, or mud wash not operated, allowing sediment to build up to the interface.
Data we would request
- Interface profile from try-cocks, sample lines or a profiling instrument, over time.
- Analysis of an interface sample: solids content and type, water, organics.
- Crude blend records and compatibility test results.
- Wash water and effluent water pH; desalting temperature.
- Demulsifier type and dose; any wetting agent in use.
- Mud wash frequency and duration.
Oil in desalter effluent water
Oil in the effluent water from a desalter or dehydrator means oil is being drawn down with the water. The interface is too low, the emulsion band has grown downward, or the water phase has too little residence time to release its oil.
Probable causes and the data we would request: Oil in desalter effluent water
Probable causes
- Interface level controlled too low, or the level instrument reading falsely high.
- Emulsion band extending down to the water outlet.
- Wash water rate above the water-phase capacity of the vessel.
- Oil-wet solids carrying oil into the water phase.
- Mud wash in operation, which gives a temporary rise that is normal.
- Reverse emulsion caused by high pH or by surfactants in the wash water.
Data we would request
- Oil in effluent water results with sample times; interface level trend.
- Wash water rate and pH; effluent pH.
- Interface profile observations.
- Mud wash schedule.
Symptom index: hydrogen PSA units
These symptoms apply to hydrogen pressure swing adsorption (PSA) units of any make. Several also apply, as noted, to temperature swing adsorption (TSA) dryers.
Declining PSA hydrogen purity
Declining hydrogen purity from a PSA unit means impurities are breaking through the beds before the adsorption step ends. Either the beds hold less than they did, or they are being asked to hold more, or impure gas is bypassing the beds through a leaking valve.
Probable causes and the data we would request: Declining PSA hydrogen purity
Probable causes
- A switching valve leaking across its seat, letting feed or tail gas pressure gas into the product or equalisation headers.
- Cycle time too long for the current feed rate or composition, including a feed flow signal that reads low.
- Feed composition changed: more impurity, less hydrogen, or a new component the bed layers were not designed for.
- Feed temperature above design, which lowers adsorbent capacity.
- Adsorbent damaged by liquid water, liquid hydrocarbon, heavy hydrocarbons, chlorides or compressor oil.
- Incomplete regeneration because tail gas pressure is higher than design.
- Bed levels dropped through attrition, or layers mixed after a bed-lifting event.
- A purity analyser or sample system fault giving a false reading.
Data we would request
- Product purity trend with the impurity identified: carbon monoxide, methane, nitrogen or carbon dioxide each point to a different layer.
- Feed flow, composition, temperature and pressure; tail gas pressure.
- Cycle step times and the cycle or capacity factor in use.
- Bed pressure profiles for every vessel over several full cycles. A bed that equalises to a different pressure from its sisters identifies a leaking valve.
- Valve stroke times and position feedback; valve maintenance history.
- Knock-out drum level history and coalescer differential pressure.
- Adsorbent age and loading records.
Declining PSA hydrogen recovery
Declining hydrogen recovery from a PSA unit means more hydrogen is leaving in the tail gas for each unit of product. It often follows operators shortening the cycle to protect purity, which treats the symptom described above and hides its cause.
Probable causes and the data we would request: Declining PSA hydrogen recovery
Probable causes
- Cycle time shortened to hold purity, so beds are regenerated before they are fully used.
- A leaking valve passing product or equalisation gas to tail gas.
- Tail gas pressure higher than design, reducing working capacity.
- Feed hydrogen content lower than design.
- The unit running in a reduced-bed mode, with fewer equalisation steps.
- Purge flow set higher than needed.
Data we would request
- Feed, product and tail gas flows and compositions, to close a hydrogen balance.
- Cycle times, operating mode and tail gas pressure trends.
- Bed pressure profiles over several cycles.
Rising bed pressure drop
Rising pressure drop across an adsorbent bed, in a PSA or a TSA unit, means the flow path through the bed is closing up. The usual reason is adsorbent breaking down into fines. The important question is why, because new adsorbent will fail the same way if the cause remains.
Probable causes and the data we would request: Rising bed pressure drop
Probable causes
- Bed lifting or fluidisation during depressurisation or repressurisation: a valve opening too fast, or a step rate set too high.
- Liquid water or hydrocarbon reaching the bed. Liquid water breaks down molecular sieve and alumina beads.
- A failed bed support screen or hold-down, letting adsorbent migrate.
- Dust from the original loading that was never blown out, or carry-over of upstream solids.
- Flow above the design velocity.
- In TSA units, heating or cooling faster than the desiccant tolerates.
Data we would request
- Differential pressure trend for each bed at a stated flow, from start of run.
- Pressure ramp rates for each step, against design.
- Dust found in downstream filters; filter change frequency.
- Knock-out drum and coalescer performance history.
- Valve stroke times; any record of control system changes.
- Inspection records: bed level, condition of the top layer, and condition of screens.
Shortened adsorbent life
Shortened adsorbent life means a loading has had to be replaced well before the life its predecessors achieved. Adsorbent in clean service is regenerated every cycle and lasts for years. Early loss of capacity means something is reaching the bed that the cycle cannot remove.
Probable causes and the data we would request: Shortened adsorbent life
Probable causes
- Liquid carry-over from an undersized, flooded or bypassed knock-out drum or coalescing filter.
- Heavy hydrocarbons or aromatics that adsorb strongly on activated carbon and do not desorb at tail gas pressure.
- Chlorides, ammonia or amines in the feed, which damage molecular sieve.
- Compressor lubricating oil.
- Water breaking through the alumina layer into the molecular sieve, for example after a wet start-up.
- Exposure to air and moisture during loading or a long shutdown.
- Adsorbent types or layer heights that do not match the current feed.
Data we would request
- Feed analysis including trace components, from a recent sample and not only the design basis.
- Knock-out and coalescer design data, liquid drain records and differential pressure.
- Analysis of spent adsorbent samples taken layer by layer.
- Loading records: types, quantities, layer heights, date, contractor and weather.
- Start-up and shutdown procedures as actually followed.
Early moisture breakthrough from a TSA dryer
Early moisture breakthrough from a TSA dryer means the product dew point rises before the adsorption step is due to end. The bed is holding less water than design, or receiving more.
Probable causes and the data we would request: Early moisture breakthrough from a TSA dryer
Probable causes
- Incomplete regeneration: regeneration temperature, flow or time below design, or a failed heater element.
- Bed not cooled fully before returning to adsorption.
- Inlet water load above design, from warmer inlet gas or a failed upstream cooler or separator.
- Liquid water carry-over onto the bed.
- Desiccant aged or contaminated.
- A leaking switching valve passing wet gas to the product side.
- A moisture analyser or sample line fault. Sample lines take hours to dry down after exposure.
Data we would request
- Product moisture trend through several full cycles.
- Regeneration gas flow, heater outlet temperature and bed outlet temperature profiles.
- Inlet gas temperature and pressure; upstream separator drain records.
- Cycle times and valve sequence; desiccant age.