
Transformers & power units
Desalter power unit
SKU AH-EC-1009
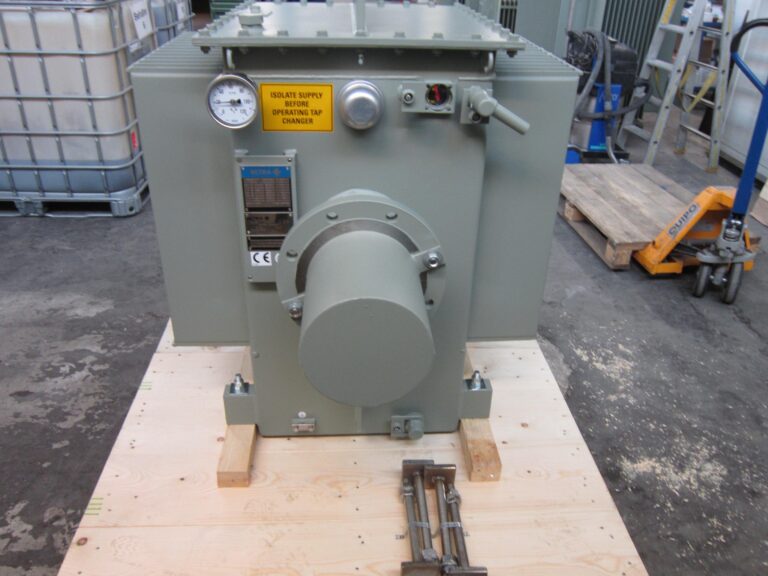
Energises the electrode grid of a crude oil desalter or dehydrator (electrostatic coalescer). The desalter power unit, also called the desalter transformer, is an…
Services
Performance surveillance is a daily engineering review of the signals that a dehydrator or desalter control system already records: interface level, power unit secondary voltage and current, inlet temperature, mixing valve pressure drop, wash water and demulsifier rates, treated crude flow, and the laboratory BS&W and salt. Axsia Howmar engineers read them against the design model of the vessel, against each other and against their own trend, and return a green, amber or red note with the cause and the action. Most faults in an electrostatic treater show in the power unit signals weeks before they show in the crude; surveillance finds them while the repair is still a planned visit and a small part, not a shutdown and a long-lead spare. It needs no new instruments and works for units of any make.
Ask about surveillance for your unit Already have a symptom? Troubleshooting
The signals
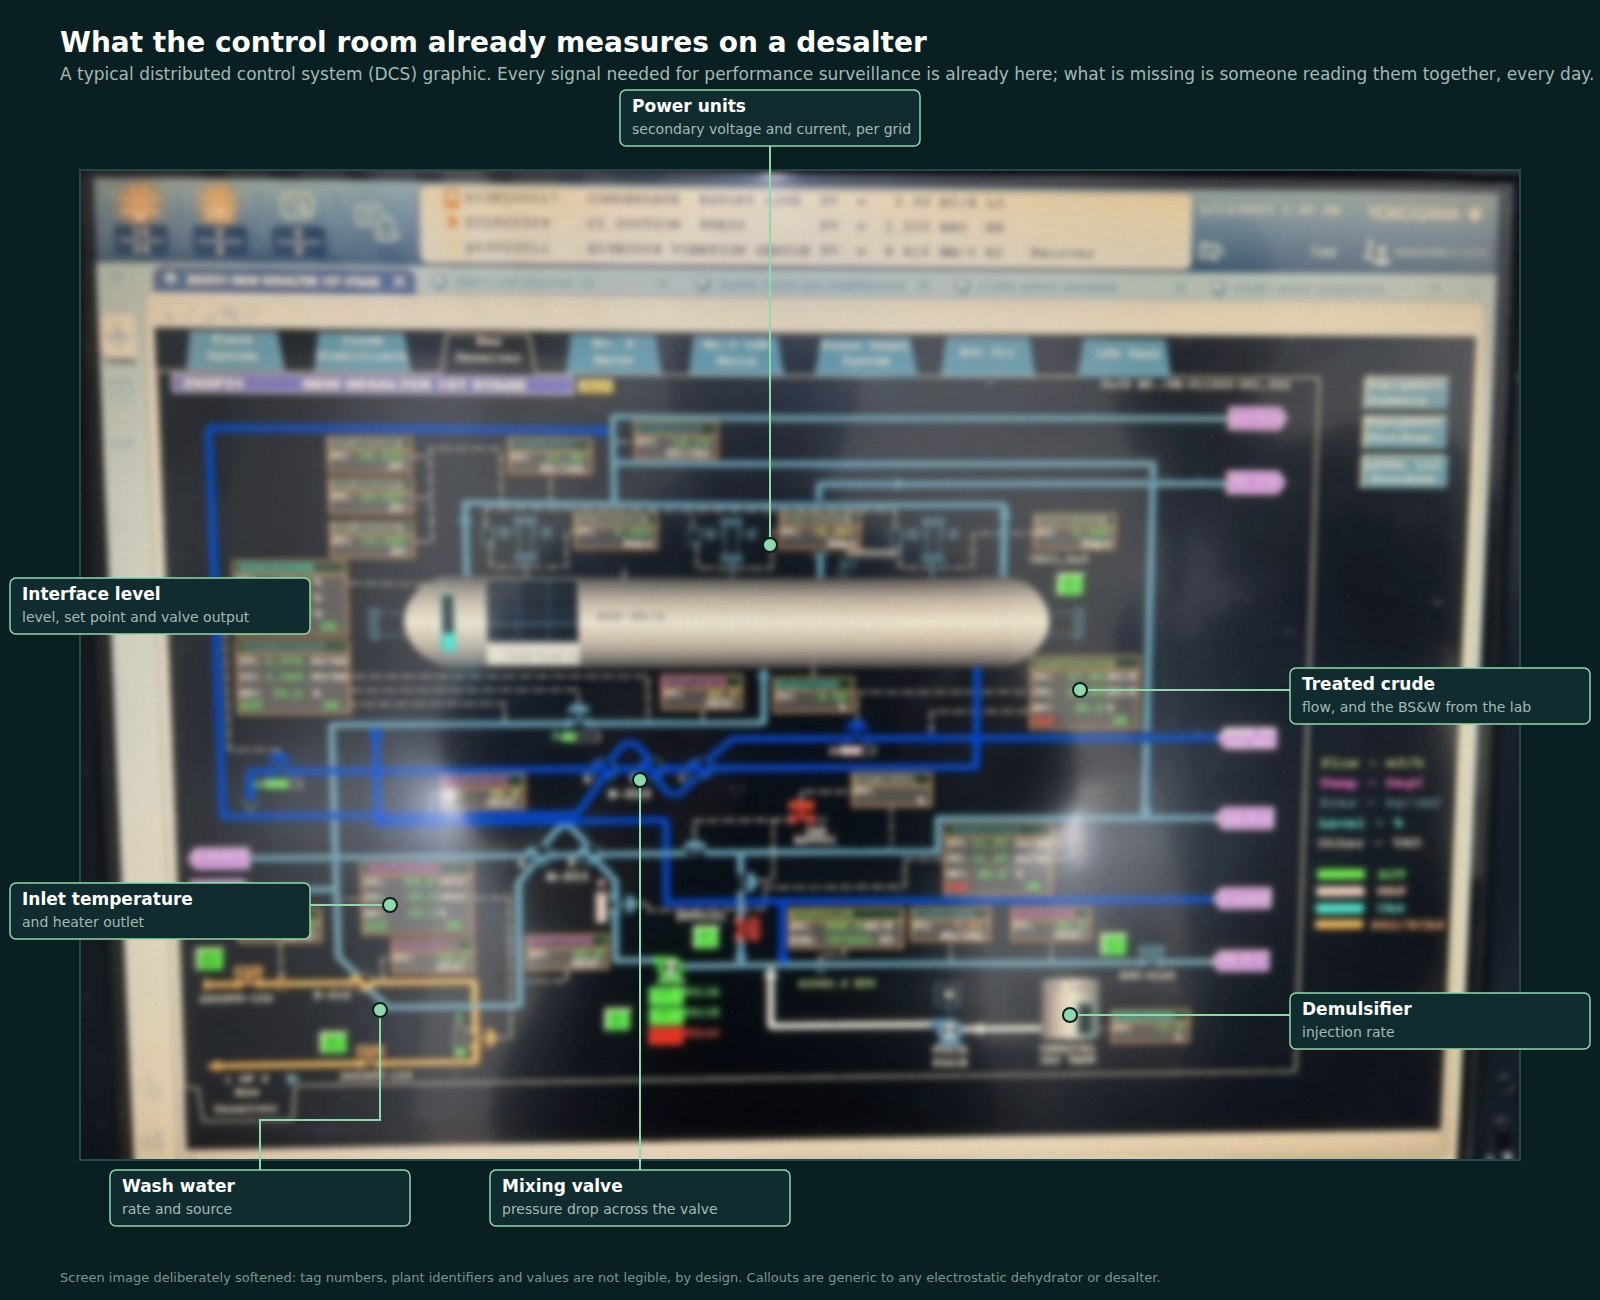
Interface level and its controller output, the secondary voltage and current of each power unit, inlet temperature, the pressure drop across the mixing valve, wash water and demulsifier rates, treated crude flow, and the laboratory BS&W and salt. Every dehydrator and desalter records most of them; a well-instrumented one records all eight. What is missing on most plants is anyone reading them together, every day, against what the vessel was designed to do.
Operations staff watch the alarms, and the alarms are set for the day the unit fails, not for the weeks before. The slow drifts that come first never cross an alarm limit, and the treated crude is the last thing to show them.
How it works
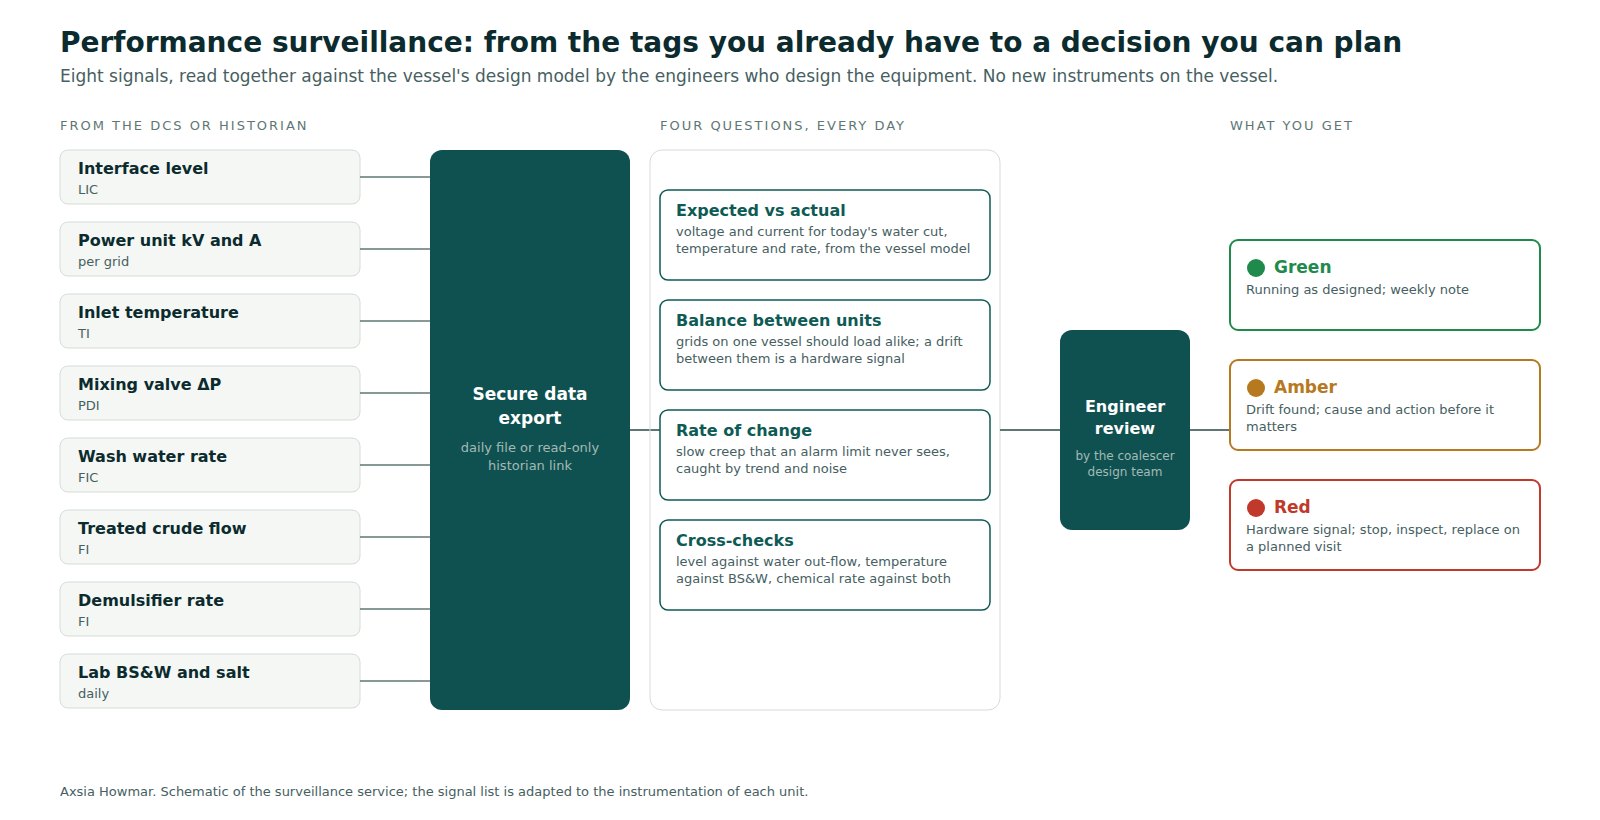
A daily export from the plant historian, or a read-only link, brings the eight signals to Axsia Howmar. The engineers who design electrostatic coalescers check them against the design model of the vessel for the water cut, temperature and rate of the day, against each other, and against their own trend. The result is a green, amber or red note: green is a weekly line; amber is a drift with its probable cause and the operating change or inspection that settles it; red is a hardware signal with the part to have ready and the planned visit to fit it.
What it finds
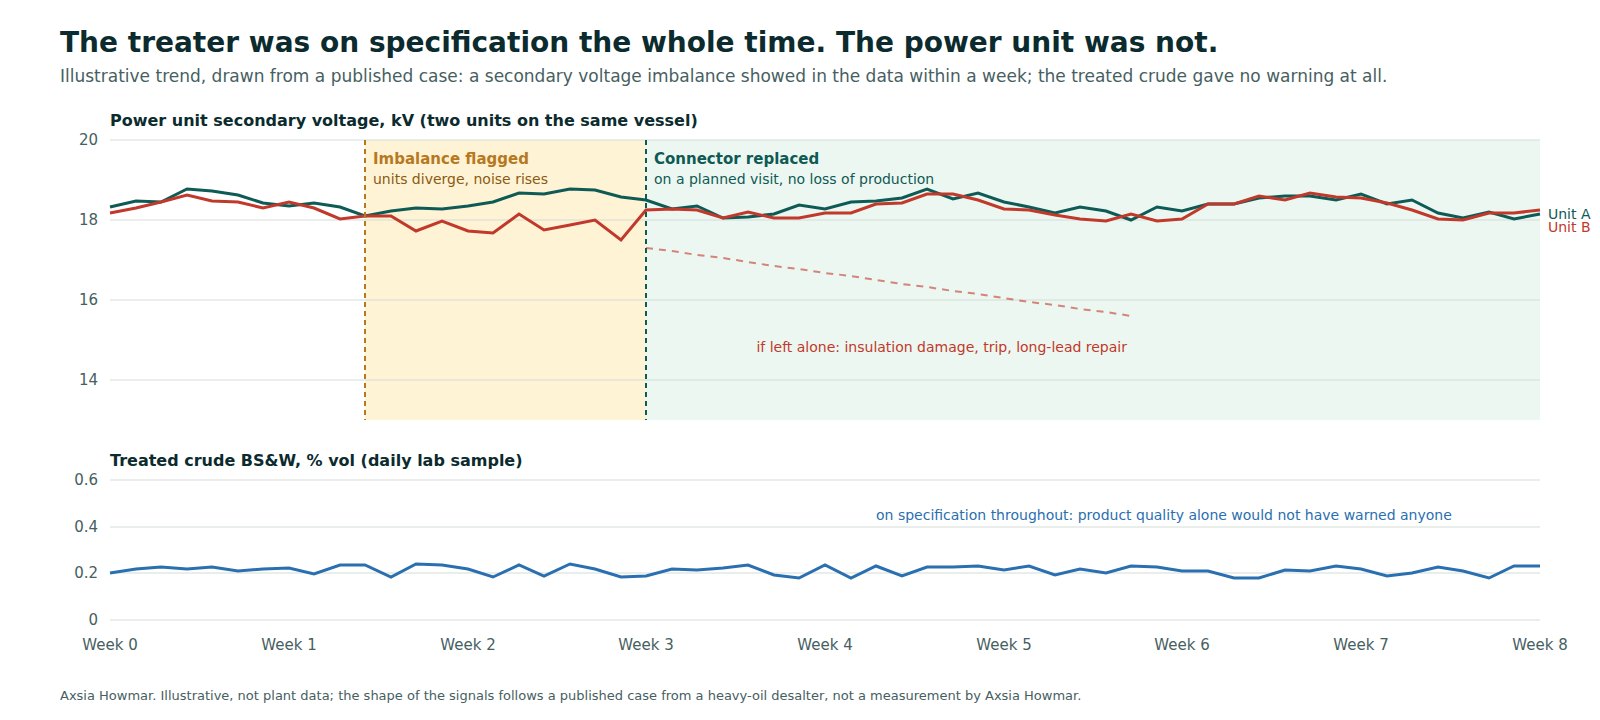
A published case from a heavy-oil desalter in the Middle East, running on brine above 100,000 ppm with limited local maintenance support and long-lead spares, shows what the power unit signals can do. Streaming data from the units was reviewed remotely against expected behaviour, and within a week of monitoring starting a non-conformance in the secondary voltage of one unit stood out. The cause was an internal connector that had been over-tightened with a wrench instead of by hand, producing a voltage imbalance that was quietly damaging the unit.
The connector was replaced on a planned visit for the price of a small part, with no loss of production. Left alone, it would have ended with a damaged treater, a long-lead spare and a reduced facility output. Throughout, the treated crude was on specification: product quality alone would never have raised the alarm. The chart below is drawn from that case; it is illustrative, not plant data.
Surveillance is a review of the signals supplied. It reports what the data shows and what to do about it; it is not a guarantee of performance or of freedom from failure.
To start
The eight signals, with units and sampling interval, as a daily export or a read-only link.
Vessel and power unit data to build the model the signals are checked against.
BS&W and salt as sampled; the cross-check between the electrical signals and the product.
Power units, bushings and insulators, so a new drift is not confused with a known condition.
The design basis, the current operating window and three months of history establish what normal looks like for this vessel, this crude and this season.
A daily export from the historian, or a read-only link, for the eight signals. Nothing is written to the plant system and no instrument is added to the vessel.
Expected against actual from the vessel model; balance between the power units on one vessel; rate of change and noise; cross-checks between level, water out-flow, temperature, chemical rate and BS&W.
Green: a weekly note. Amber: a drift with its probable cause and the operating change or inspection that settles it. Red: a hardware signal with the part to have ready and the planned visit to fit it.
What was found, what was done and what the signals did afterwards go into the unit's record, so the next review starts from a better baseline.
| Data item | Why it is needed |
|---|---|
| Historian tags for the eight signals, with units and sampling interval | The review runs on these |
| Original datasheets, power unit nameplates and the current operating window | Builds the vessel model the signals are checked against |
| Laboratory BS&W and salt results, as sampled | The cross-check between the electrical signals and the product |
| Maintenance history of the power units, bushings and insulators | Separates a new drift from a known condition |
| A named contact in operations | An amber or red note needs someone who can act on it |
Partial data is normal. Send what you have and we will tell you what else matters.
Outcomes depend on the condition of the equipment, the feed and the operating envelope. Nothing on this page is a performance guarantee.
A crude oil degasser dehydrator is a two-vessel package: a degasser stacked above an electrostatic dehydrator on one skid. The crude flashes in the upper vessel…
An electrostatic coalescer prewash removes entrained caustic from kerosene after the caustic prewash of a kerosene sweetening unit. A high-voltage direct current (DC) field makes the…
In a refinery the crude oil desalter is the first process unit the crude meets, and everything downstream depends on it: preheat exchangers, the crude column…
A crude oil desalter and a crude oil dehydrator are the same vessel: a horizontal pressure vessel with electrode grids energised at high voltage by power…
A desalter power unit is the oil-filled transformer that energises the electrode grids of an electrostatic desalter or dehydrator. It steps the plant supply up to…
An electrostatic coalescer prewash removes entrained caustic from kerosene after the caustic prewash of a kerosene sweetening unit. A high-voltage direct current (DC) field makes the…
Troubleshooting a desalter, dehydrator or hydrogen pressure swing adsorption (PSA) unit starts with the symptom, because each symptom has a short list of probable causes and…
Process and detailed design turns a requirement, often no more than a datasheet, into a complete package that a fabricator can build and an operator can…
A design review for capacity enhancement establishes what actually limits an existing crude oil treatment train or hydrogen purification unit, and which changes remove that limit…
Transformers & power units
SKU AH-EC-1009
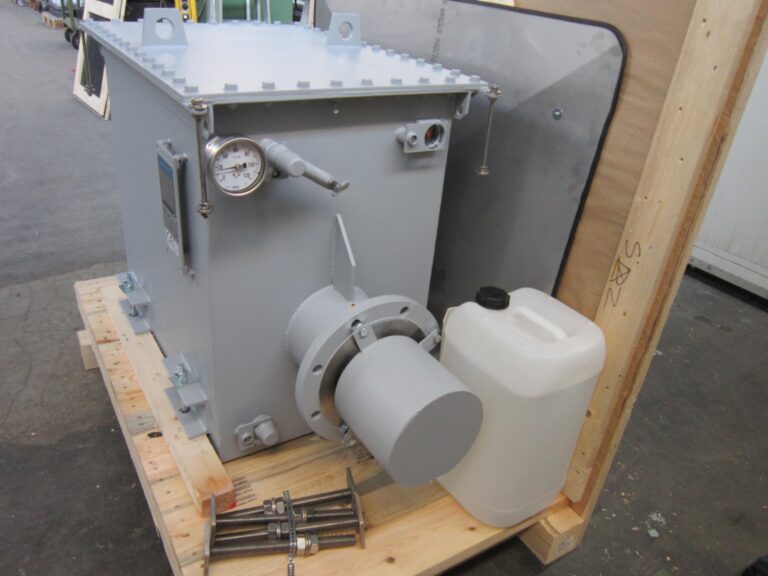
Energises the electrode grid of a crude oil desalter or dehydrator (electrostatic coalescer). The desalter power unit, also called the desalter transformer, is an…
Transformers & power units
SKU AH-EC-1010
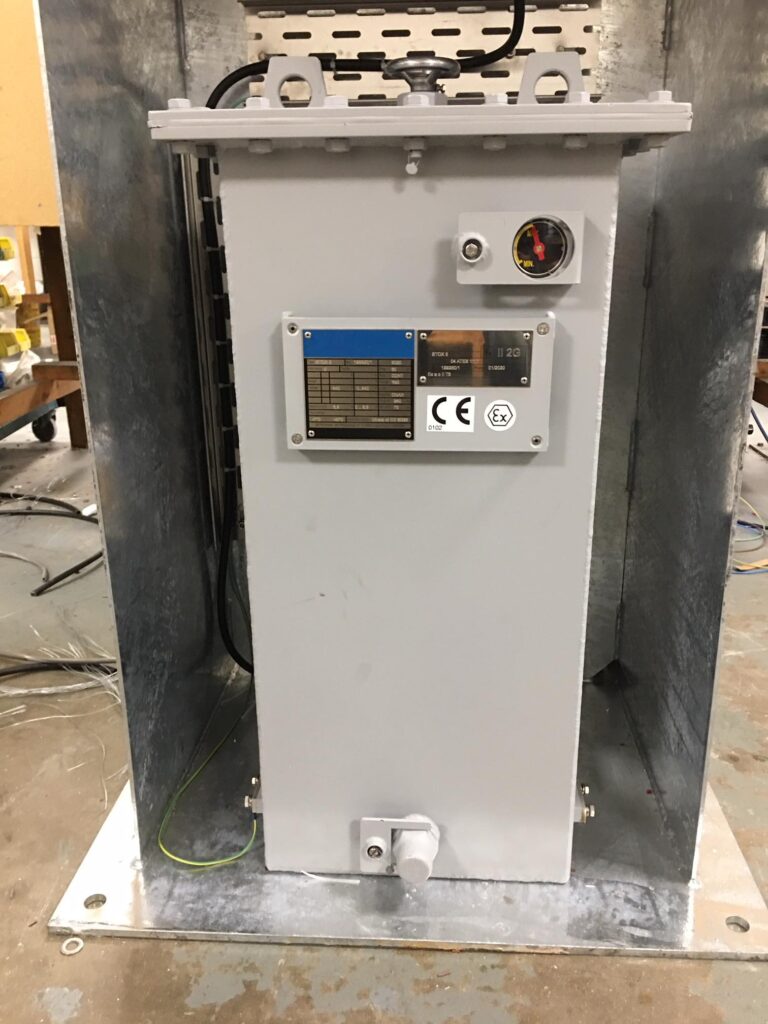
Energises the electrode grid of an electrostatic coalescer prewash (the electrostatic precipitator on the caustic prewash of a kerosene sweetening unit). Steps up and…
Add to enquiry: DC power unit for electrostatic coalescer prewash
Transformers & power units
SKU AH-EC-1011
Varies the input voltage to the DC power unit of an electrostatic coalescer prewash. A custom-made motorised auto-transformer (variac) on the primary side of…
Add to enquiry: Transformer voltage regulator (variac) for DC power unit
Injection & mixing
SKU AH-EC-1007
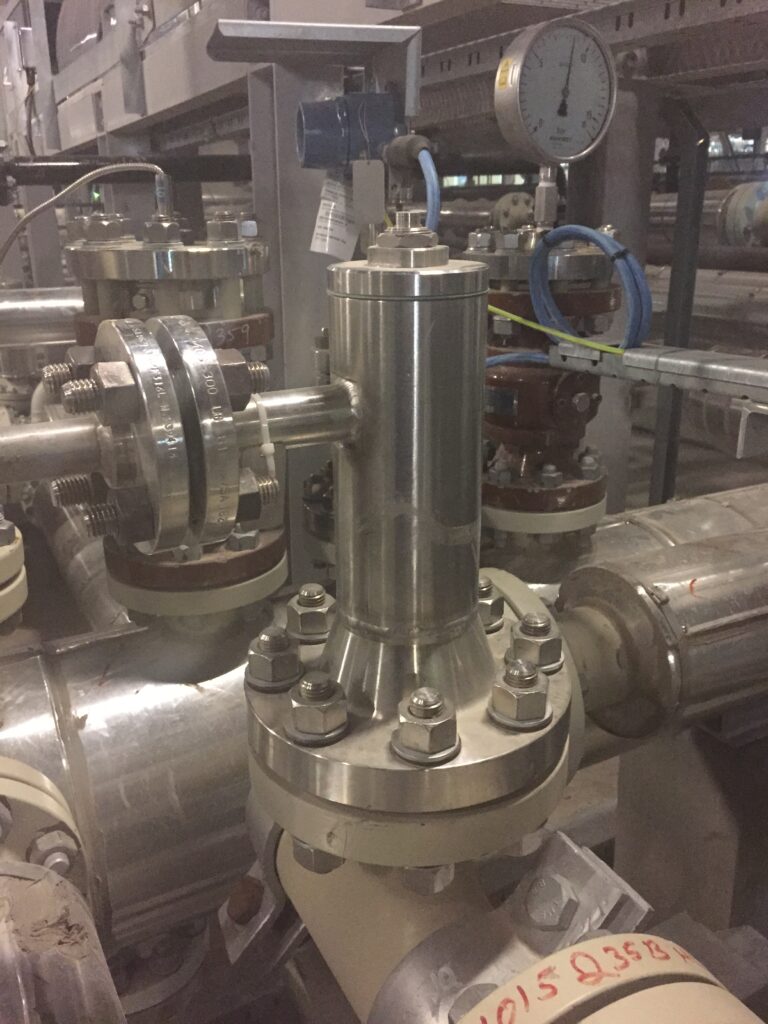
Introduces a chemical or water stream into the process line ahead of an electrostatic coalescer, prewash coalescer or desalter mixing valve: demulsifier or wash…
Instrumentation & controls
SKU AH-EC-1008
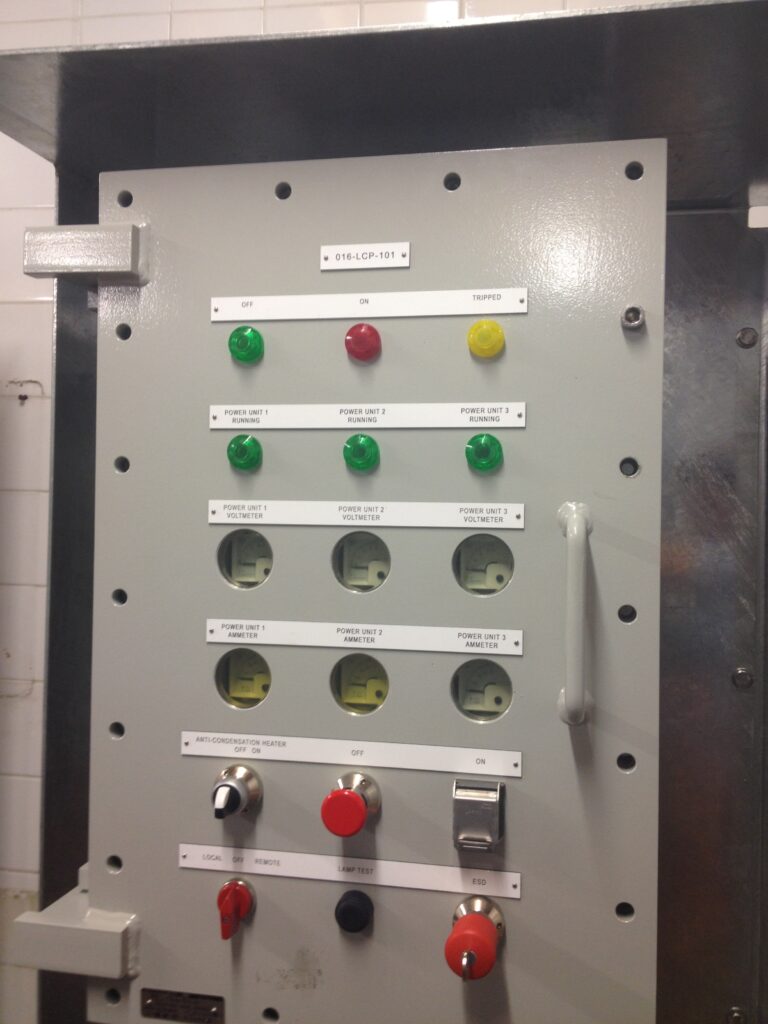
Replacement components for the local control panel that supplies and protects the power unit of an electrostatic coalescer, desalter, dehydrator or prewash coalescer: the…
Bushings & insulators
SKU AH-EC-1001
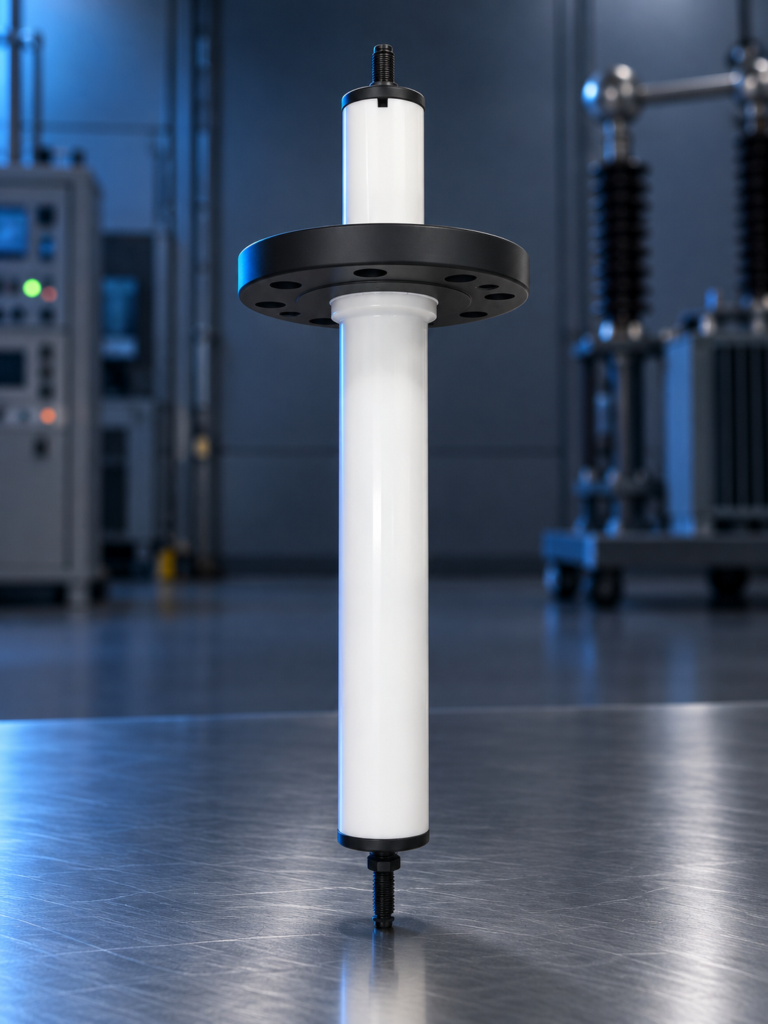
The desalter entrance bushing, also called the high-pressure entrance bushing, carries the high-voltage conductor from the transformer or power unit through the pressure boundary…
The 2026 energy shock is a diesel shock. With the Strait of Hormuz closed and Russian product exports halted, the IEA counts 1.6 million barrels a…
The closure of the Strait of Hormuz in February 2026 took a fifth of the world's seaborne jet fuel off the market and sent the European…
High basic sediment and water (BS&W) at the outlet of an electrostatic dehydrator or desalter has a short list of possible causes. This paper sets out…
Questions engineers ask
Troubleshooting starts from a symptom that has already appeared and works back to the cause. Surveillance starts every day from the signals and looks for the drift that comes before the symptom. The two share the same engineers and the same vessel model; surveillance is what keeps most units from ever needing the troubleshooting service.
The treated crude only goes off specification when the vessel has already lost part of its capacity. The secondary voltage and current of each power unit respond at once to a change in the vessel: a rising interface, water or gas in the grid zone, a tracking insulator, a loose connection, an unbalanced output. A published case from a heavy-oil desalter showed a voltage imbalance within a week of monitoring that was traced to an internal connector over-tightened with a wrench; it was replaced on a planned visit for the cost of a small part, with no loss of production, while the crude had been on specification throughout.
No. A daily export of the eight tags, or a read-only link from the plant historian, is enough. Nothing is written back to the plant system, no software is installed on it, and no instrument is added to the vessel. The arrangement is agreed with your control and IT staff before anything is connected.
Yes. The vessel model is built from the datasheets, nameplates and drawings of the unit, whoever built it, and the signal list is adapted to the instrumentation that exists. Dehydrators, desalters, degasser dehydrators and prewash coalescers of any make are covered.
No. Surveillance is a review of the signals supplied: it reports what the data shows and what to do about it. Faults that leave no electrical or process signature, or that develop faster than the review interval, can still occur. What it changes is how many faults are caught early, and how many repairs become planned work.
Tell us the equipment, the duty and what you are seeing. Partial data is normal: send what you have and we will tell you what else matters. We acknowledge every enquiry within 1 working day.